【R】主成分分析と探索的因子分析で顧客満足度を分析する

初めまして、Datum StudioのLeon(リオン)と申します。
本記事では模擬案件を通じて、分析手法の説明を行います。
依頼内容は、3つの航空会社にがランダムで1000名顧客を対象にアンケート調査したデータを利用して、自社のどこが他の2社より優れているのか、もしくは劣っているのか?また、顧客の体験も一緒に知りたいとのです。
今回使用する手法は主成分分析(PCA)と探索的因子分析(EFA)です。
(具体的な紹介はWikipediaのページをご覧ください:主成分分析、探索的因子分析(英語))
早速ですが、始めましょう。
0. 模擬案件の背景
今回の顧客はA航空会社です。彼達がランダムで1000人利用者に3つ航空会社に対する満足度のアンケートを取りました。
※ 生データはここでダウンロードできます。(Data download)
データ中の変数(値の範囲は 1 ~ 9で、1 は最低値、9 は最高値):
# Easy_Revervation : 座席の購入やすさ
# Preferred_Seats : 座席の選択
# Flight_Options : 航空便の選択
# Ticket_Prices : チケットの価格
# Seat_Comfort : 座席の座り心地の良さ
# Seat_Roominess : 席の大きさ
# Overhead_Storage : 収納棚の大きさ
# Clean_Aircraft : 機内の清潔さ
# Courtesy : 礼儀
# Friendliness : 親切さ
# Helpfulness : 有用さ
# Service : 機内サービスの良さ
# Satisfaction : 満足度
# Fly_Again : 再度利用する
# Recommend : 友人に推薦する
# ID : 回答者番号
# Airline : AirlineCo.1 ~ AirlineCo.3 計 3 社
1. パッケージの読込
# library
library(readr)
library(dplyr)
library(corrplot)
library(gplots)
library(RColorBrewer)
library(GPArotation)
2. データインプット
# Input data
airline<-read.csv("https://raw.githubusercontent.com/happyrabbit/DataScientistR/master/Data/AirlineRating.csv")

# Check data
glimpse(airline)
データを一回確認します。
# Observations: 3,000
# Variables: 17
# $ Easy_Reservation <int> 6, 5, 6, 5, 4, 5, 6, 4, 6, 4, 5, 5, 6, 5, 5, 3, 6,...
# $ Preferred_Seats  <int> 5, 7, 6, 6, 5, 6, 6, 6, 5, 4, 7, 5, 7, 6, 6, 5, 7,...
# $ Flight_Options   <int> 4, 7, 5, 5, 3, 4, 6, 3, 4, 5, 6, 6, 6, 5, 6, 4, 4,...
# $ Ticket_Prices    <int> 5, 6, 6, 5, 6, 5, 5, 5, 5, 6, 7, 7, 6, 7, 7, 6, 8,...
# $ Seat_Comfort     <int> 5, 6, 7, 7, 6, 6, 6, 4, 6, 9, 7, 7, 6, 6, 6, 7, 7,...
# $ Seat_Roominess   <int> 7, 8, 6, 8, 7, 8, 6, 5, 7, 8, 8, 9, 7, 8, 6, 8, 8,...
# $ Overhead_Storage <int> 5, 5, 7, 6, 5, 4, 4, 4, 5, 7, 6, 6, 7, 5, 4, 6, 6,...
# $ Clean_Aircraft   <int> 7, 6, 7, 7, 7, 7, 6, 4, 6, 7, 7, 7, 7, 7, 6, 7, 7,...
# $ Courtesy         <int> 5, 6, 6, 4, 2, 5, 5, 4, 5, 6, 4, 6, 4, 5, 5, 5, 6,...
# $ Friendliness     <int> 4, 6, 6, 6, 3, 4, 5, 5, 4, 5, 6, 7, 5, 4, 4, 4, 6,...
# $ Helpfulness      <int> 6, 5, 6, 4, 4, 5, 5, 4, 3, 5, 5, 6, 5, 4, 5, 5, 5,...
# $ Service          <int> 6, 5, 6, 5, 3, 5, 5, 5, 3, 5, 6, 6, 5, 5, 4, 5, 5,...
# $ Satisfaction     <int> 6, 7, 7, 5, 4, 6, 5, 5, 4, 7, 6, 7, 6, 4, 4, 6, 7,...
# $ Fly_Again        <int> 6, 6, 6, 7, 4, 5, 3, 4, 7, 6, 8, 6, 5, 4, 6, 6, 6,...
# $ Recommend        <int> 3, 6, 5, 5, 4, 5, 6, 5, 8, 6, 8, 7, 6, 5, 6, 7, 7,...
# $ ID               <int> 1, 2, 3, 4, 5, 6, 7, 8, 9, 10, 11, 12, 13, 14, 15,...
# $ Airline          <fct> AirlineCo.1, AirlineCo.1, AirlineCo.1, AirlineCo.1...
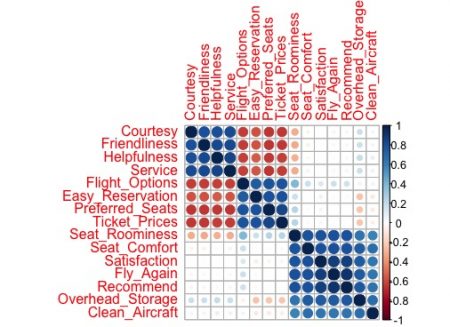
変数間の相関度を確認します。
# Correlation
select(airline, Easy_Reservation:Recommend) %>%
  # Get Correlation Matrix
  cor() %>%
  # Plot correlation map
  corrplot(, order="hclust")
※ ブルーになるほど相関度が「1」に近い、レッドになるほど相関度が「0」に近いです。
上記の図から、変数間の相関度が「1に近い」か、「ほぼ0」か、「-1に近い」かがわかります。
3. 主成分分析
# PCA analysis
airline.pc <- select(airline, Easy_Reservation : Recommend) %>%
  prcomp()
summary(airline.pc)
各航空会社の平均点を取ります。
# Get mean scores of variables for each airline
airline.mean <- select(airline,-ID) %>%
  group_by(Airline) %>%
  summarise_each(funs(mean)) %>%
  glimpse()
結果
# Observations: 3
# Variables: 16
# $ Airline          <fct> AirlineCo.1, AirlineCo.2, AirlineCo.3
# $ Easy_Reservation <dbl> 5.031, 2.939, 2.038
# $ Preferred_Seats  <dbl> 6.025, 2.995, 2.019
# $ Flight_Options   <dbl> 4.996, 2.033, 2.067
# $ Ticket_Prices    <dbl> 5.997, 3.016, 2.058
# $ Seat_Comfort     <dbl> 6.988, 5.009, 7.918
# $ Seat_Roominess   <dbl> 7.895, 3.970, 7.908
# $ Overhead_Storage <dbl> 5.967, 4.974, 7.924
# $ Clean_Aircraft   <dbl> 6.947, 6.050, 7.882
# $ Courtesy         <dbl> 5.016, 7.937, 7.942
# $ Friendliness     <dbl> 4.997, 7.946, 7.914
# $ Helpfulness      <dbl> 5.017, 7.962, 7.954
# $ Service          <dbl> 5.019, 7.956, 7.906
# $ Satisfaction     <dbl> 5.944, 3.011, 7.903
# $ Fly_Again        <dbl> 5.983, 3.008, 7.920
# $ Recommend        <dbl> 6.008, 2.997, 7.929
図を描くため、行の名前を「1、2、3」から「AirlineCo.1、AirlineCo.2、AirlineCo.3」に変更します。
# Change rownames of airline.mean
row.names(airline.mean) <- airline.mean$Airline
airline.mean <- select(airline.mean,-Airline)
ヒートマップを描きます。
# Plot heatmap
heatmap.2(as.matrix(airline.mean), col=brewer.pal(5,"YlGn"), trace="none", key=FALSE, dend="none", cexCol=0.6, cexRow =1)
title(main = "Mean values for different airlines")
 ※ 色が濃いほど点数が高い。
この図から、AirlineCo.3(航空会社3)が2/3以上の項目が他の2社より優れていることがわかります。また、AirlineCo.2(航空会社2)が点数が一番低い項目が3社の中で最も多いことがわかります。
4. 探索的因子分析(EFA)
# Factor analysis
airline.fa <- airline %>%
  subset(select = Easy_Reservation : Recommend) %>%
  factanal(factors=3, rotation="oblimin")
title(main = "Factor load of airline satisfactory")
各因子の重要度を算出します。
# Calculate the factor score
airline.fa <- airline %>%
  subset(select = Easy_Reservation : Recommend) %>%
  factanal(factors = 3, rotation = "oblimin", scores = "Bartlett")

fa.score<-airline.fa$scores %>%
  data.frame()
結果:
#                         Factor1 Factor2 Factor3
# Easy_Reservation                          0.941
# Preferred_Seats                           0.880
# Flight_Options           0.167            0.803
# Ticket_Prices                             0.887
# Seat_Comfort             0.865
# Seat_Roominess           0.844   -0.242
# Overhead_Storage         0.833    0.137  -0.142
# Clean_Aircraft           0.708
# Courtesy                          0.818
# Friendliness                      0.868
# Helpfulness                       0.953
# Service                           0.922
# Satisfaction             0.921
# Fly_Again                0.943
# Recommend                0.942
上記の結果からもうすでに15個変数を影響している潜在変数の意味をほぼ推定できます。
# Factor 1 : 全体的な体験
# Factor 2 : 機内サービス体験
# Factor 3 : チケット購入体験
各航空会社の因子の平均点を算出します。
fa.score$Airline <- airline$Airline

fa.score.mean <- fa.score %>%
  group_by(Airline) %>%
  summarise(Factor1 = mean(Factor1),
            Factor2 = mean(Factor2),
            Factor3 = mean(Factor3))
図を描くため、行の名前を「1、2、3」から「AirlineCo.1、AirlineCo.2、AirlineCo.3」に変更します。
row.names(fa.score.mean) <- as.character(fa.score.mean$Airline)
fa.score.mean <- select(fa.score.mean,-Airline)
ヒートマップで因子を図表化します。
heatmap.2(as.matrix(fa.score.mean), col = brewer.pal(5,"YlGn"), trace = "none", key = FALSE, dend = "none", cexCol = 0.6, cexRow = 1)
title(main="Average factor load satisfaction for each airline")
 ※ 色が濃いほど点数が高い。
上記の図の解釈の例:AirlineCo.1(航空会社1)は「Factor 3 : チケット購入体験」では他社より優れていますが、「Factor 2 : 機内サービス体験」ではもっと工夫する必要があります。
5. まとめ
今回はデータの前処理が要らず、単純に分析するだけの仕事で、結構時間の節約ができました。通常の生データ前処理は総案件の半分以上、偶に70%以上の時間をかかるケースもあります。
PCAとEFAの使い方は少しでもお役に立ちましたでしょうか?今後面白そうな模擬案件がありましたら、また紹介いたします。
Bye~

